Apache is often credited as being the technology that powers the Web. It was launched in 1995, and since 1996 is known to have been one of the most popular servers. Understanding the traffic entering your application, the problems, and the functioning of the user-facing components is made possible by the visibility Apache logs provide. We’ll examine what the Apache web server logs are today, how to read them, and how to evaluate them quickly.
What are Apache logs?
Apache is a part of the Linux LAMP software stack (Linux, Apache, MySQL, PHP). Apache logs are text files that hold all the data about the Apache server. They reveal information about which resources were accessed, when, and other relevant data. They also provide details about the mistakes, the resource mapping procedure, the connection’s final resolution, and much more. When someone visits your website, Apache is in charge of serving them.
The server keeps an access log and enables access for visitors to your website. These recordings, often known as log files, can be a valuable source of data regarding the usage and demographics of your website.
In general, there are several stages to the entire Apache logging process. To use the logs for historical analysis, you must first store them somewhere. Second, you must parse and analyze the logs to extract pertinent data and metrics. Finally, you could graph the data because a human can more easily examine and comprehend a visual depiction. With Apache Log Analyser tools, you can ease the overall process and complete your work. But first, let’s understand a few terminologies.
What are the Apache access logs?
The Apache access logs are text files containing details about each request the Apache server handled. You can anticipate finding details such as the date and time of the request, the requested resource, the response code, the response time, and the IP address used to send the request.
Requirements –
- A Linux system running Apache web services
- A user account with root (sudo) access
- Terminal window (Ctrl-Alt-T in Ubuntu, Alt-F2 in CentOS)
You can use a graphical interface to obtain the Apache access logs if you’re logged into a web server using cPanel – a Linux-based GUI for managing servers and websites. To facilitate end users’ access to and automate key activities, web hosting providers preinstall cPanel on hosting servers. These duties include managing domains, hosting websites, emails, and more.
Ways to Monitor Apache Logs
Unix Command-Line Tools
The location of the Apache server access log varies based on your operating system.
- The Red Hat, CentOS, or Fedora Linux access logs are in the /var/log/httpd/access_log.
- On Debian and Ubuntu, you can find the Apache logs in the /var/log/apache2/access.log and
- FreeBSD will have the Apache server access logs stored in /var/log/httpd-access.log
You can access Apache error logs from var/log/apache2/error.log. You can then log out the errors from the error log file using: Sudo tail -f/var/log/apache2/error.log.
Running this command will help view the errors in the terminal as they occur in real-time. You can use these errors to monitor the operations on your website and troubleshoot issues on the web server.
Apache log levels
LogLevel directive can customize each module’s log message level. For instance, we might have the following configuration directive if we wanted the main log level for all events to be set to the info level but the error level exclusively for the rewrite module:
LogLevel info rewrite: error
Logging levels as described in Apache server documentation:
- emerg
- alert
- crit
- error
- warn
- notice
- info
- debug
- trace1 – trace8
emerg means the system is unstable, and the trace levels are used for very low-level information logging that you may skip.
Tail, Grep, and Egrep Commands
Combining two commands will get the best outcomes. You can monitor specific data from a log file using tail and grep tools. This is fantastic since you won’t have to read pointless messages from the server. Here are some situations where combining tail and grep commands may be necessary.
Specifying an IP Address
tail -f /var/log/apache2/access.log | grep 192.168.206.1
Excluding File Types From the Requests
tail -f /var/log/apache2/error.log | egrep -v “(.gif|.jpg|.png|.swf|.ico)”
Similarly, if you want to get only a specific file, you can run: tail -f /var/log/apache2/error.log | grep .png.
Now, you’ll be monitoring only logs with .png file types. Some tools can assist you in viewing data in a UI. Using commands and a console to examine data can be difficult, especially in larger setups with multiple logs and a significant volume of log data.
How to View Apache Error Logs?
Opening the text file is necessary to view the Apache server error logs. They are essentially plain text files because the error logs are identical to the access logs. To investigate them, you can employ whatever tools you like. However, analyzing logs from numerous Apache servers dispersed across data centers can take time and effort.
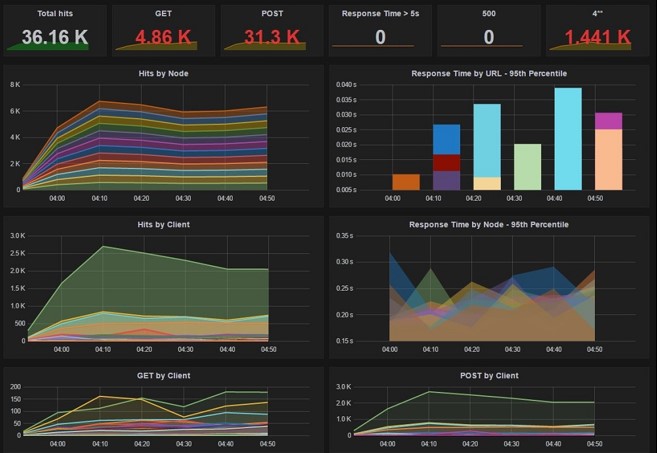
Using a Dashboard to Monitor Apache Logs
Although monitoring log messages using command-line tools is simple, reading log messages on a console is challenging due to the high noise and low signal. If you can read these log messages in a way that makes it simple to identify the issue with the server, it will be much better and more straightforward.
Wrapping Up
Understanding the traffic entering your application, the mistakes, and the functionality of the user-facing components may all be learned through analyzing the Apache server logs. Comprehending your user’s activity requires more than just understanding server logs; it also requires knowing what resources were accessed, by whom, and how long it took to process the request. To respond as quickly as possible, you must also ensure that you are aware of every mistake.
The ability to slice and dice Apache metrics and logs, receive alerts when problems arise, and gain visibility into every aspect of your environment are no longer nice-to-haves; they are necessities.